Web Shop Now Open!

To celebrate the completion of Noösphere, the book of digital collages that I’ve been working on since 2014, I’ve put up a new “shop” page where you can purchase copies of the book:

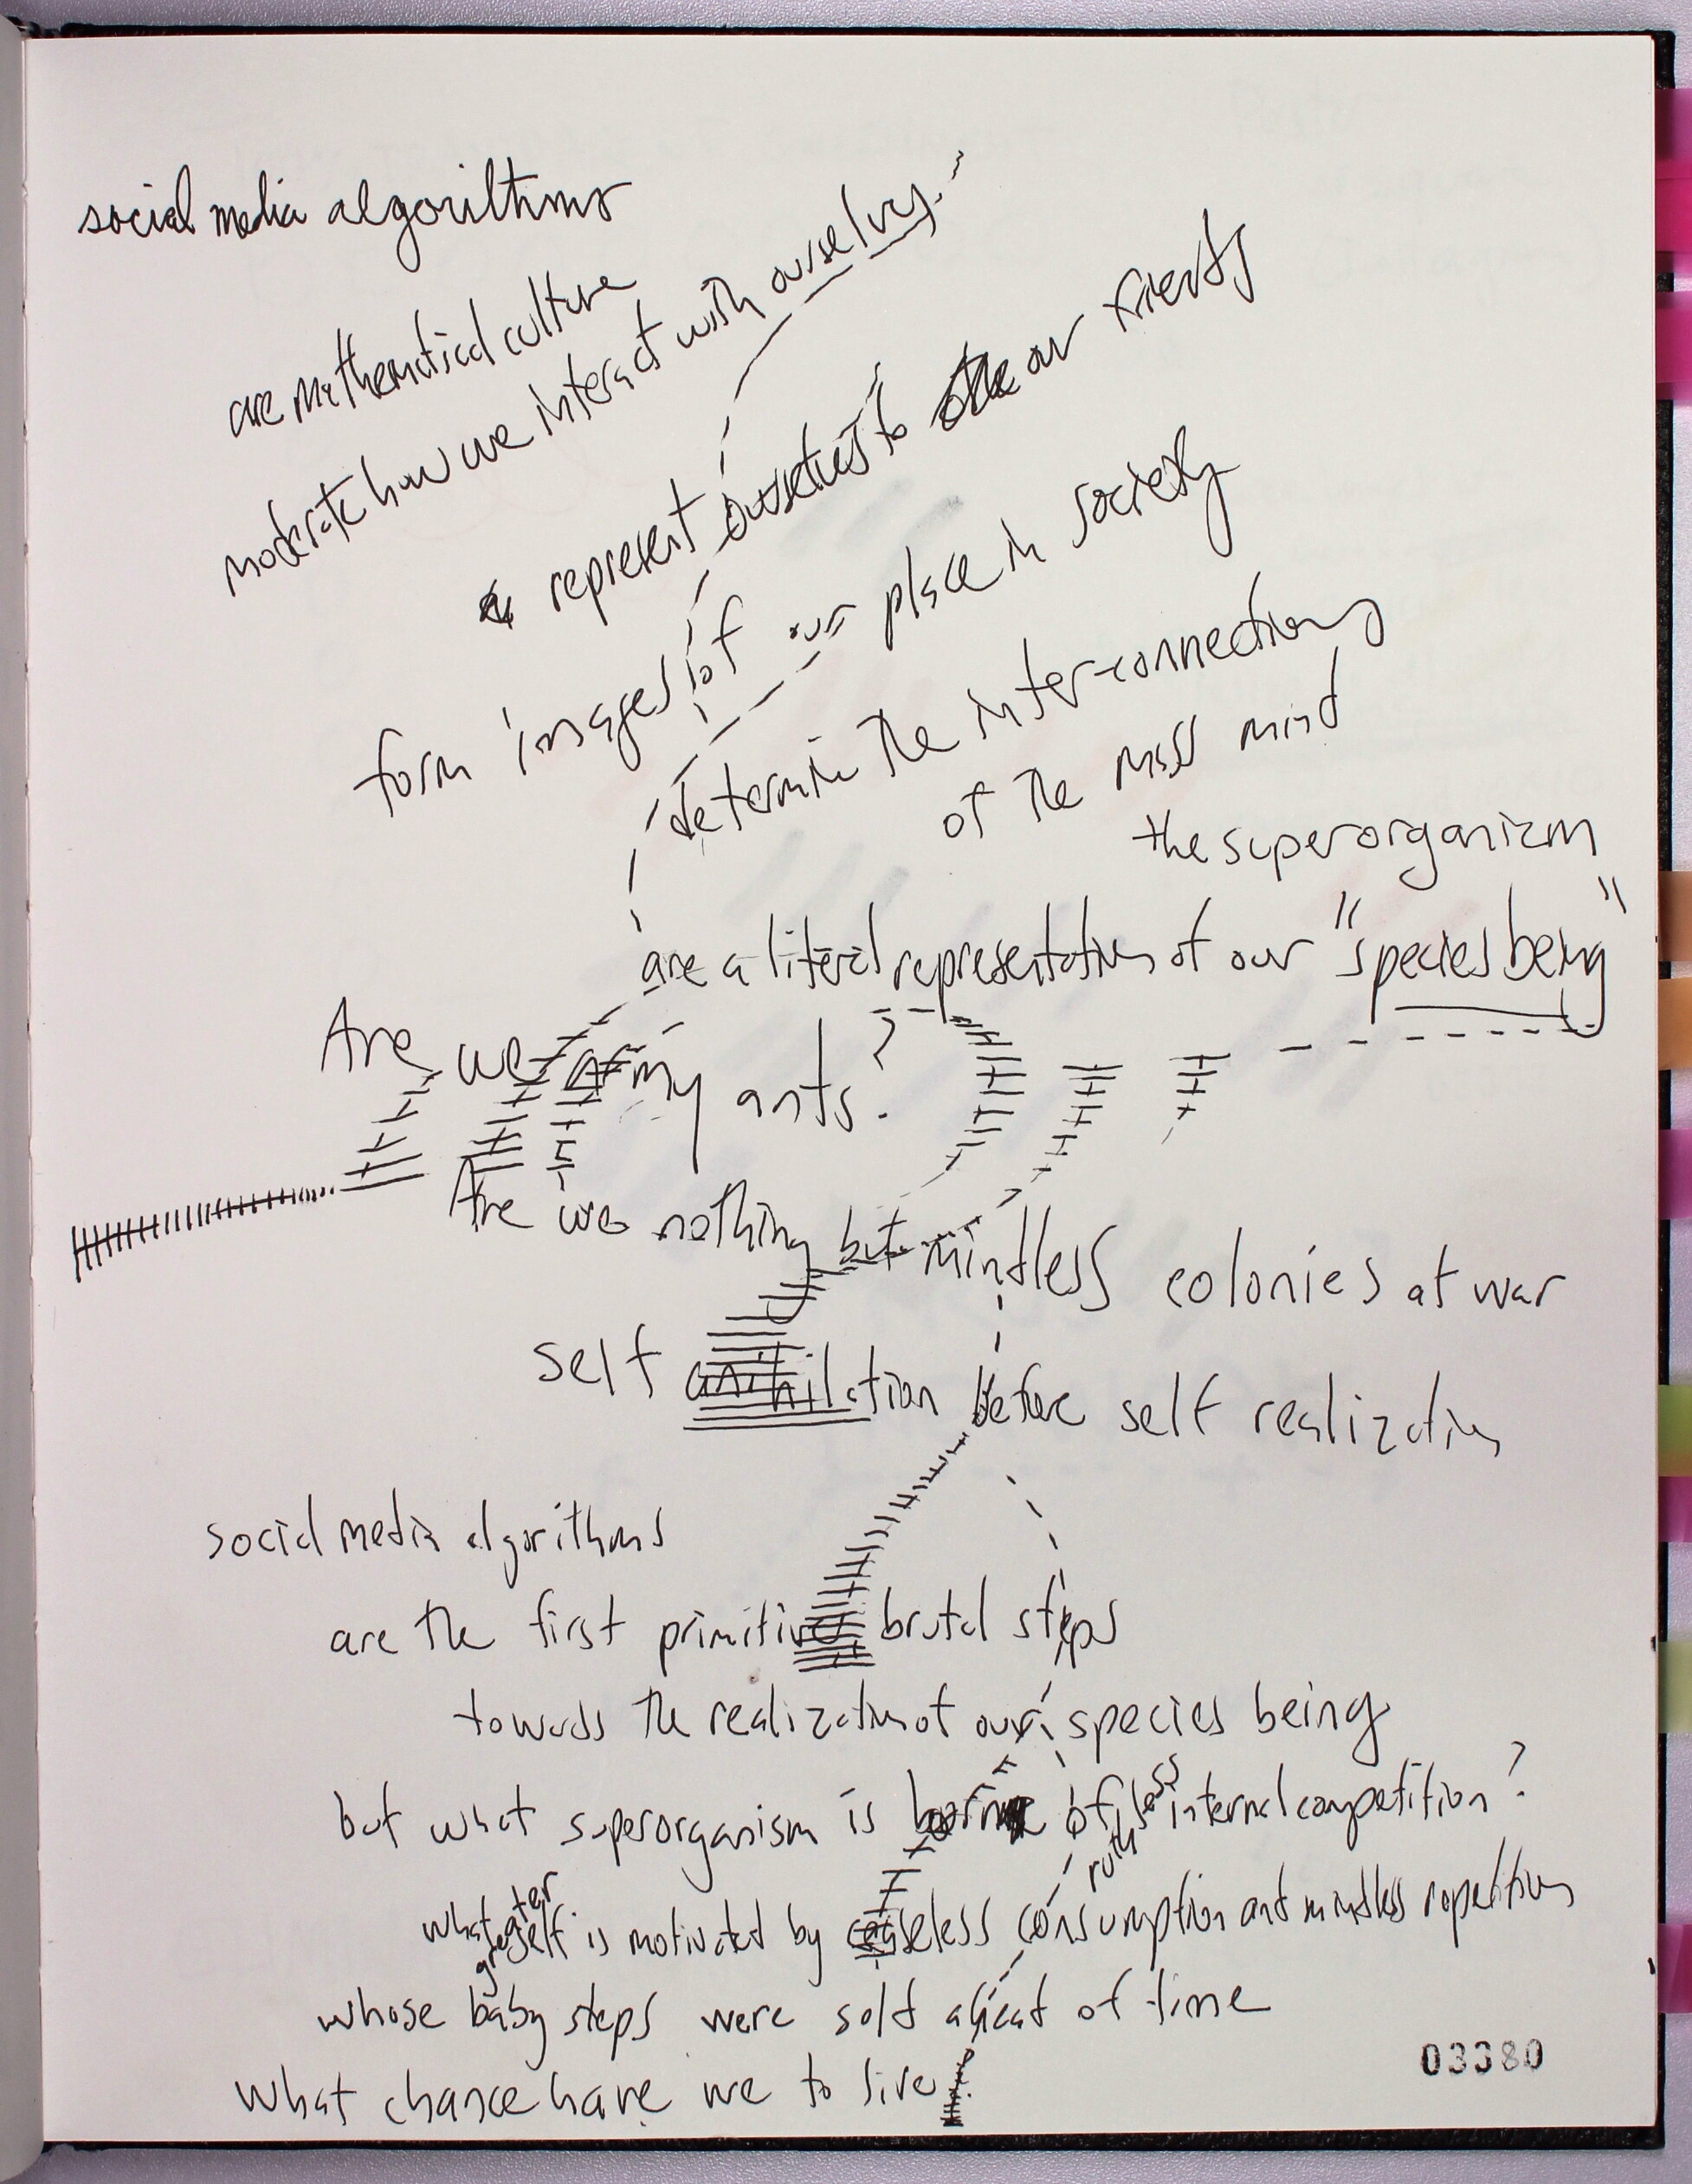
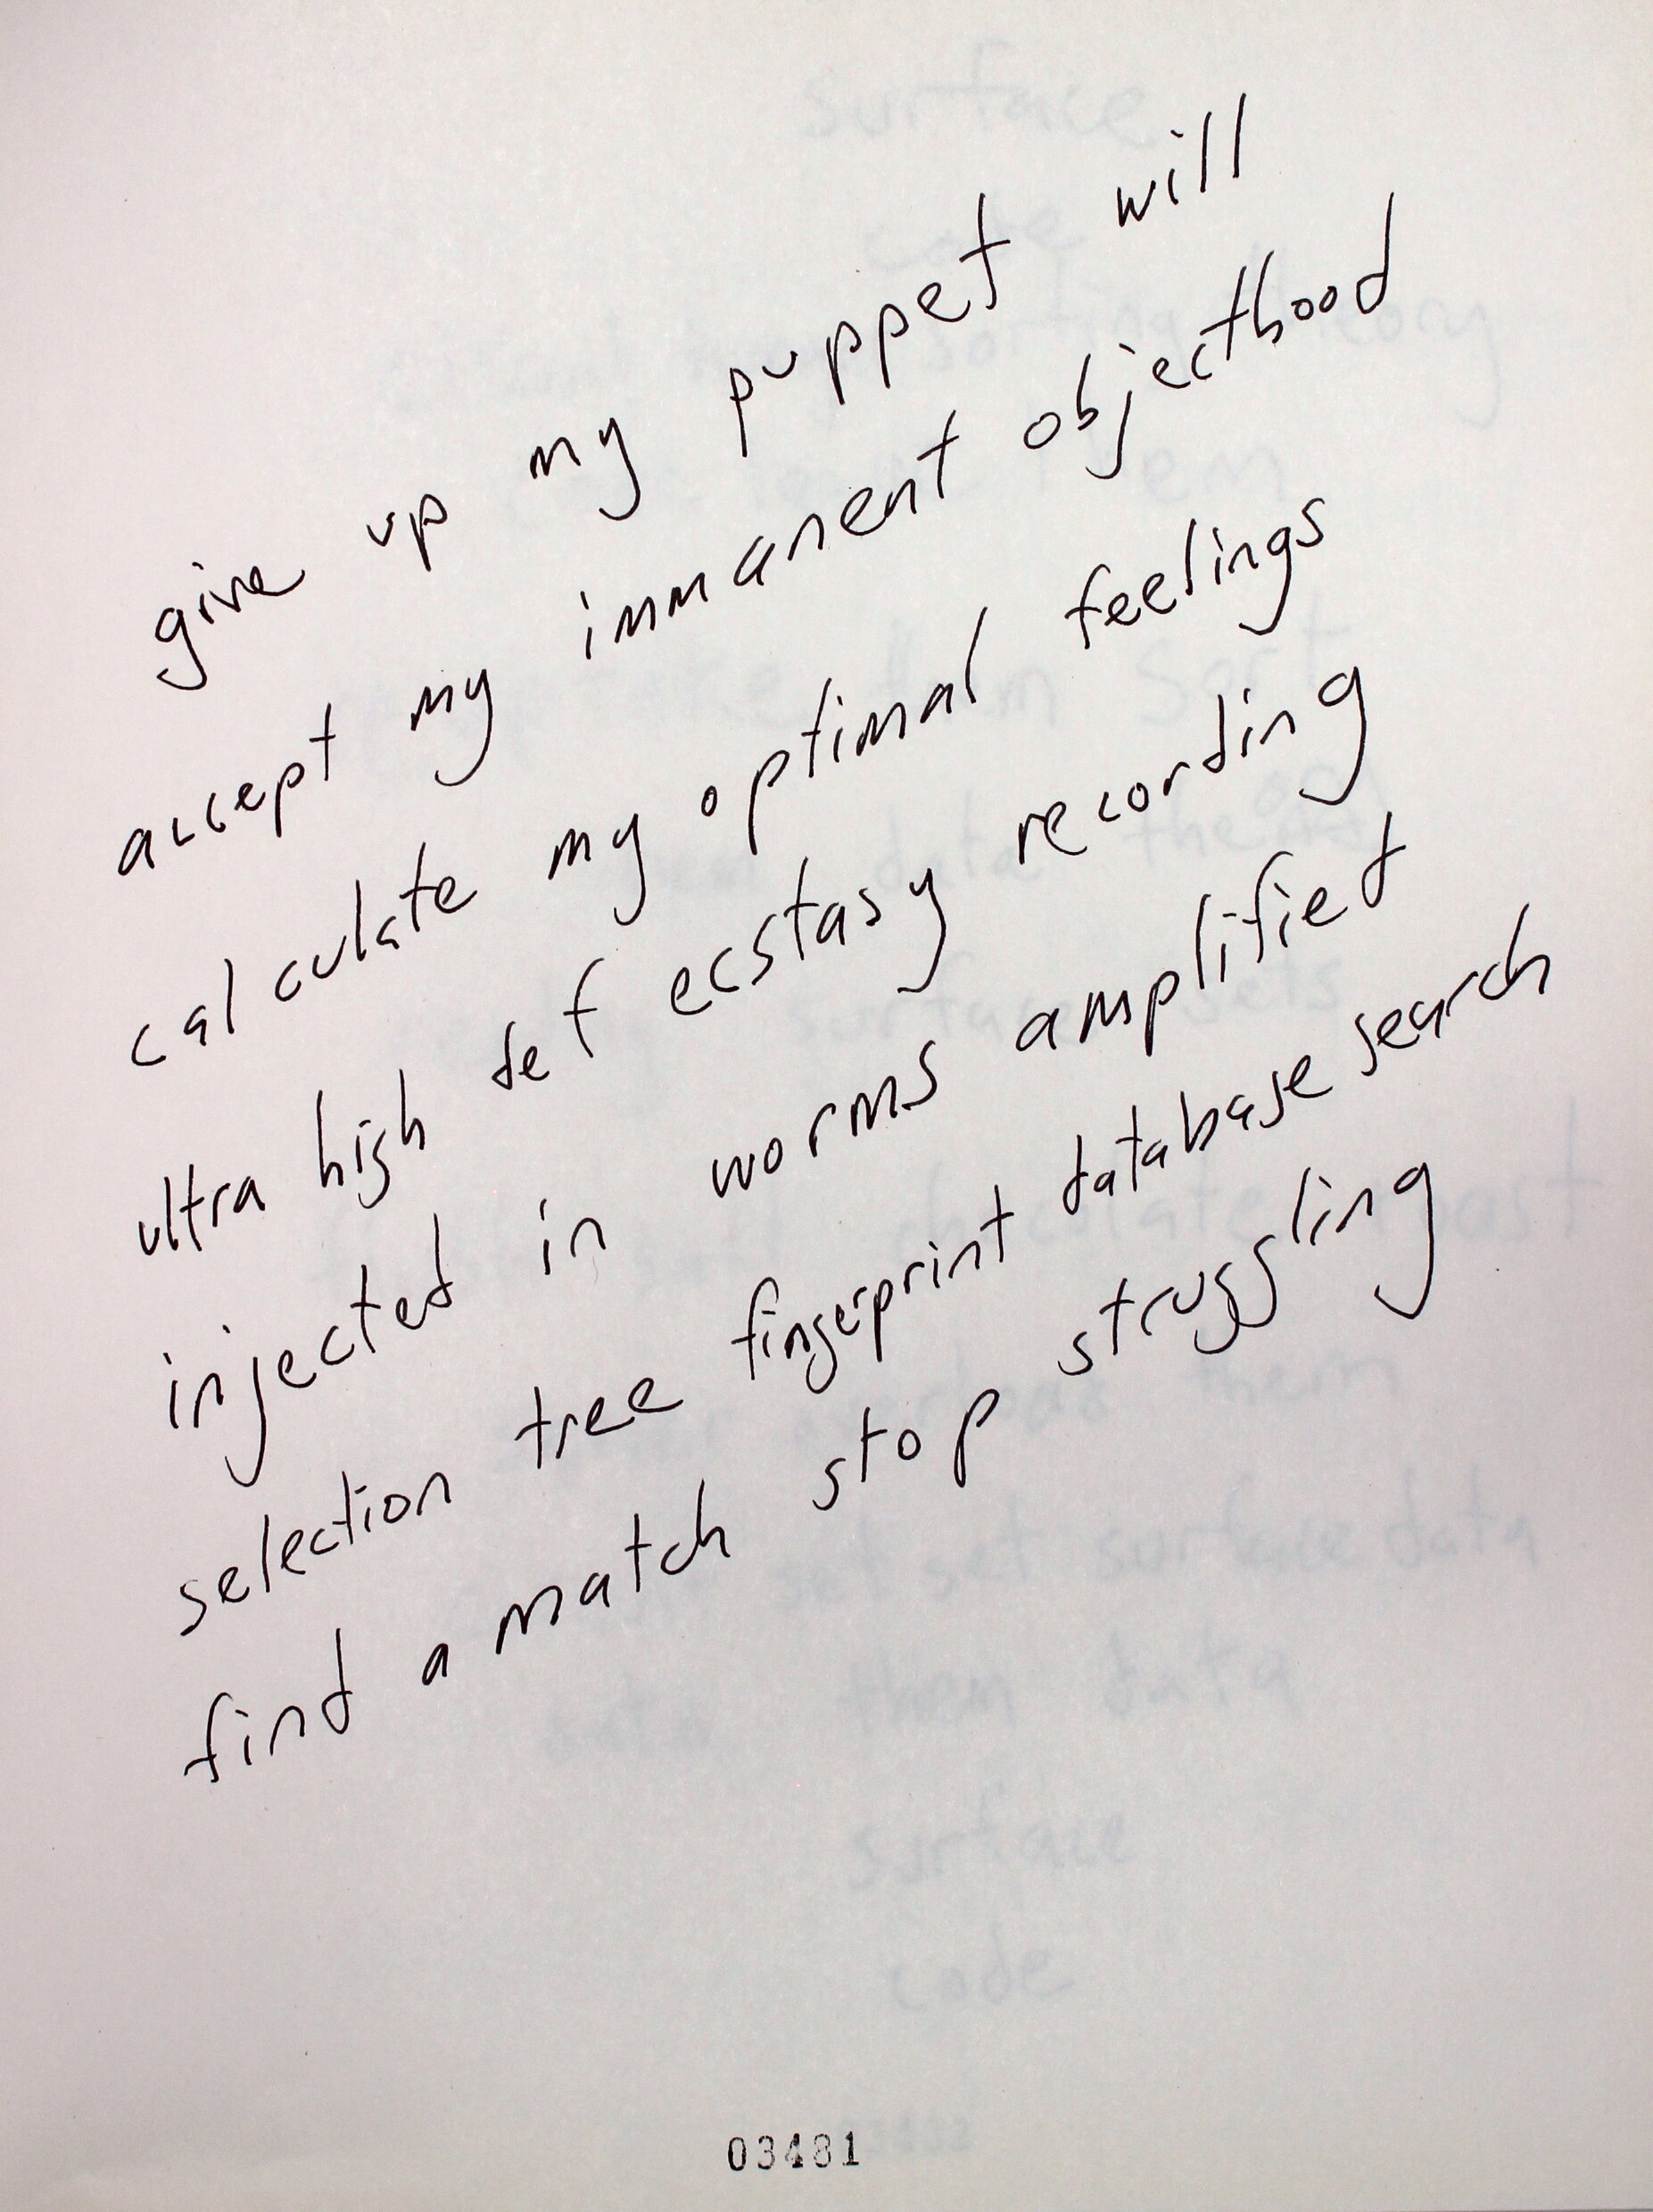
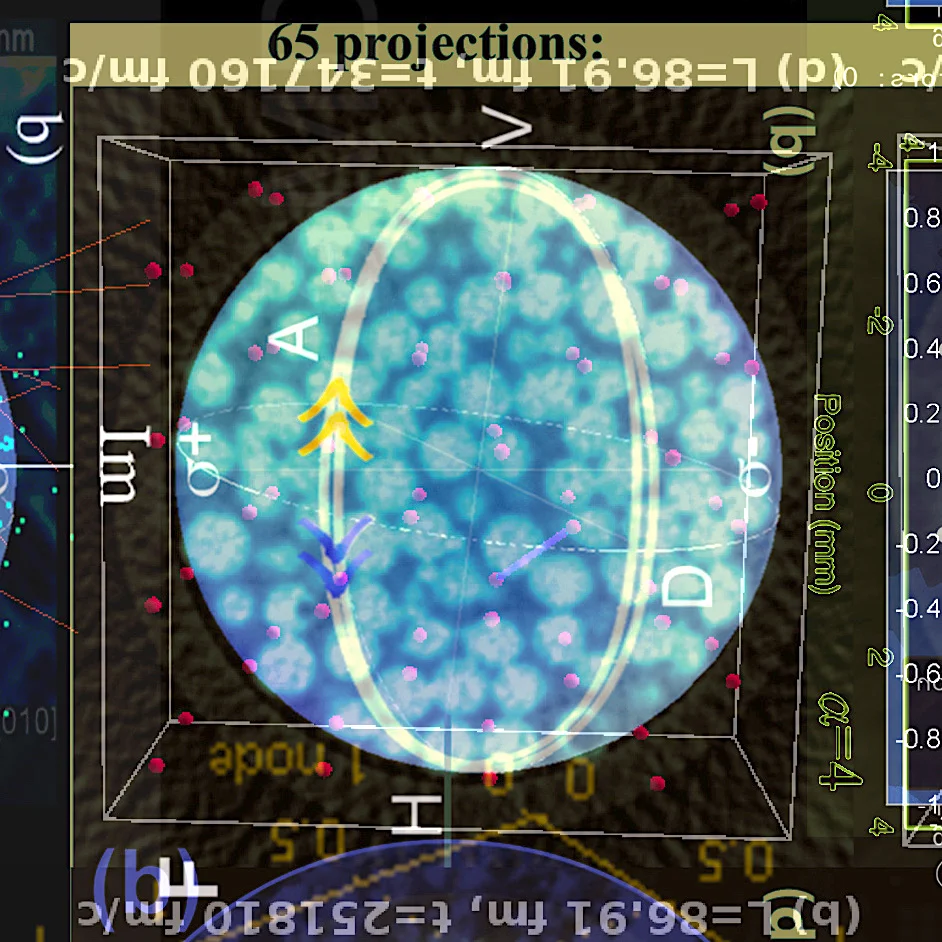
The definitive collection of artist Farley Gwazda’s Noösphere series, which makes use of an extensive archive of scientific figures, data visualizations, and examples of imaging technology to create information-dense digital collages that resemble planets, cells, subatomic particles, or magical orbs. Contains a selection of more than 50 images, and tells the story of the process whereby they were created.

My main reason for embarking on this e-commerce journey is to make the work accessible and get it into people’s hands. I’ve tried to make the book affordable, but I’ve got a perfectionist streak and I need the work to look just so. I’ve experimented with many different methods of printing on demand, reviewed dozens of proofs, and the processes I’ve chosen are not inexpensive. But I think you’ll be happy with the products when they arrive and they will last a long time.

Note: I have discontinued offering prints of the Noöspheres. Thanks to everyone who purchased one!

Your support means a lot to me. Thank you!

Digitized video of undergrad work

This is documentation of my senior thesis exhibition at Bard College in 2001, including large kinetic zoötrope sculptures.

Thanks to Chester Gwazda for finding this old tape and getting it digitized! :)

noise available

Gwazdor’s trial trilogy consists of three albums: shamecoin, augmented, and howling at the exomoon.

Please note that this is noise music and may not be decipherable or appropriate for all audiences. Visit gwazdor’s bandcamp page to listen to the albums, purchase files for download, and read more about the circumstances of their creation.

New Noösphere Grids

These collages, each featuring 5x5 noöspheres, were assembled from a subset of source images where multiple interrelated figures were arranged in a regular grid. This enabled an explicitly combinatoric compositional strategy.

Front cover of new Noösphere Book.

Front cover of new Noösphere Book.

Back cover of new Noösphere book.

Back cover of new Noösphere book.

I am currently working on finishing my self-published Noösphere book - good things come to those who wait! ;)

FOUND


3 x 3 inch drawing.


Shadow Government Notes

A collection of stencils, notes, organizational systems, and other ephemera from the process of creating the Shadow Government project 2019 - 2020.

FOUND

Found: A series of images generated by misusing an online neural net - not sure which one or how.

Experiments with Noösphere Grids

Experimenting with Noösphere compositions making use of a subset of my library of images appropriated from the sciences - images with multiple figures laid out in a square grid, i.e. example, below:


The image below is a 10 x 10 grid of 100 Noöspheres. Playing with overlap, layering and repetition. This isn’t a finished artwork, per se. - still working on it:

The following are just examples of cropped details of the grid, above:

Note that this is not how I’d composed the earlier “single frame” Noösphere collages. The grid puts strong limitations on compositional choice (although there’s still a bit of wiggle room). But it introduces more macroscopic choices in terms of selection of grids. It’s a challenge to make all the frames come together - they have a tendency toward hyperbolic growth.

Open Studios

Thanks to everyone who came out to the Open Studio here in Berkeley on June 22nd!

Here are some images of the work hung in the studio. :)

Sources for Noösphere collages

Having finished the first proof of the Noösphere book, I am thinking about how to present the work. As is, there is no text in the book, other than the text that appears in the images. Do I want to include some sort of explanation of the process, or footnotes or an appendix? My first instinct is not to include anything - to let the images just be themselves. The issue is that once I delve into the text, I open up a whole new set of questions about how the included text frames the work, and I’m not sure I want to get into that at this point.

Anyway, to test this out, I’ve done some research and dug up the source images and associated text for the following Noösphere:

6 of 7 layers positively identified. One layer (Source 5) tentatively identified.

ARTICLE TITLES FOR EACH LAYER:

Flare Spots in Intravascular Optical Coherence Tomography Images of Bioabsorbable Stents

Cytoskeletal Dynamics During Cytokinesis

Oscillatory phase separation in giant lipid vesicles induced by transmembrane osmotic differentials

Thrombin and fibrinogen γ′ impact clot structure by marked effects on intrafibrillar structure and protofibril packing

Origin, structure, and role of background EEG activity

Interactions between Inhibitory Interneurons and Excitatory Associational Circuitry in Determining Spatio-Temporal Dynamics of Hippocampal Dentate Granule Cells

Ambient seismic noise tomography of Canada and adjacent regions: Part I. Crustal structures

SOURCES:

Source 1: 04023_gr1.jpg here

Flare Spots in Intravascular Optical Coherence Tomography Images of Bioabsorbable Stents
Flare spots (Figures 1A and 1B) are observed in intravascular optical coherence tomography (IVOCT) images of bioabsorbable stent struts in patients and have no analog in metallic stents. Gutiérrez-Chico et al. (1) proposed that flare spots were located at hinge points where the highest strain is experienced during deployment, suggesting that they represent micro-crazes (fine lines) in the polymer. Nonetheless, the mechanism for the presence of flare spots in IVOCT images, and the large variation in their appearance where no two are alike, is not known. In this study, micro-CT and IVOCT images of a bioabsorbable stent deployed in a cylindrical phantom blood vessel were coregistered and compared in order to investigate the underlying mechanism for presence of flare spots in IVOCT images.

Source 2: de-mitosis-lg.jpg here

Cytoskeletal Dynamics During Cytokinesis: von Dassow, Bement, Foe, Odell

Sand dollar zygotes during first mitosis, fixed and stained for microtubules and chromosomes (single confocal sections). Top row: metaphase, early anaphase, late anaphase; bottom row: successive stages in furrowing. A variety of experiments imply that microtubules stimulate cortical contractility in the cell equator, but also many experiments purport to show that microtubules are dispensable after mid-anaphase (right-most frame in the top row). In an urchin egg like this one, microtubules have reached the cell poles at this stage, but not the equator. They only reach the equator after furrow initiation (left frame, bottom row). How can this be?

Source 3: elife-03695-fig3-v1.jpg here

Oscillatory phase separation in giant lipid vesicles induced by transmembrane osmotic differentials

Interrupted imaging of oscillatory phase separation: Z-stack projections of height-resolved fluorescence images of the lower hemisphere of a GUV consisting of POPC:SM:Ch (1:1:1) labeled with 0.5% Rho-DPPE (pseudo-colored red). The GUV encapsulates 200 mM sucrose, and the external dispersion medium is diluted in MilliQ water. Images are acquired at 25°C at arbitrary time points; (A) 0 s, (B) 99 s, (C) 148 s, (D) 299 s, (E) 550 s, and (F) 692 s. The first image was taken ∼2 hr after imposing the osmotic gradient. Scale bar: 5 µm.

Source 4: F1.large-4.jpg here

Thrombin and fibrinogen γ′ impact clot structure by marked effects on intrafibrillar structure and protofibril packing: Marco M. Domingues, Fraser L. Macrae, Cédric Duval, Helen R. McPherson, Katherine I. Bridge, Ramzi A. Ajjan, Victoria C. Ridger, Simon D. Connell, Helen Philippou and Robert A. S. Ariëns

Thrombin effects on fibrin clot network and fibrin fiber size. Transmission electron microscopy images under dried conditions of fibrin clots made with human plasminogen-depleted IF-1 purified fibrinogen (1 mg/mL), CaCl2 (2.5 mM), and thrombin at concentrations of (A) 0.1, (B) 1.0, and (C) 10 U/mL. Scale bars, 500 nm. (D) Fibrin fiber radius obtained by measurement of n = 50 fibrin fibers at 0.1, 1.0, and 10 U/mL thrombin. The individually plotted data represent the dispersion of the fiber size within the clot, and the bar represents the mean value. Statistical significance, using a 1-way analysis of variance (ANOVA), is denoted with ****P < .001 for comparison between 0.1 U/mL and the remaining thrombin concentrations.

Source 5: Fig_005.jpg here

Origin, structure, and role of background EEG activity

Methods: High-density 8×8 intracranial arrays were fixed over sensory cortices of rabbits. EEGs were spatially low pass filtered, temporally bandpass filtered and segmented in overlapping windows stepped at 2 ms. Phase was measured with the cosine as the temporal basis function, using both Fourier and Hilbert transforms to compensate for their respective limitations. Spatial patterns in 2D phase surfaces were measured with the geometric form of the cone as the spatial basis function.

Source 6: fnsys-09-00155-g011.jpg here

Interactions between Inhibitory Interneurons and Excitatory Associational Circuitry in Determining Spatio-Temporal Dynamics of Hippocampal Dentate Granule Cells: Phillip J. Hendrickson*, Gene J. Yu, Dong Song and Theodore W. Berger

Simulation results when strengthening and weakening three individual synaptic connections in the granule-mossy-basket cell network. All raster plots show 1,000 ms of activity. (A1,B1) Shows balanced synaptic weights. (A2,B2) Show alterations to the MC-GC synaptic weights. (A3,B3) Show alterations to the MC-BC synaptic weights. (A4,B4) Show alterations to the BC-GC synaptic weights. When the excitatory mossy cell loop is strengthened relative to the inhibitory basket cell loop, a pattern of theta-modulated gamma oscillations develops (A3,A4,B2).

Source 7: FigS1_CCF_HF.jpg here

Ambient seismic noise tomography of Canada and adjacent regions: Part I. Crustal structures

Figure 3. Representative examples of stacked cross-correlation functions from continuous ambient seismic noise data. For each 100 km distance interval, only the trace with the highest signal-to-noise (SNR) ratio, defined as the ratio between the largest absolute amplitude and the mean absolute amplitude, is plotted. No filter is applied to waveforms. High-pass filtered (corner frequency at 0.1 Hz) and low-pass filtered (corner frequency at 0.02 Hz) plots are provided in the supporting information (Figures S1 and S2, respectively) for readers who are interested in assessing the data quality at different frequency ranges. Locations of stations are shown in Figure 2.

So like what's up with the new site?

I am excited to announce the public launch of this new artist website.

For far too long I’ve been using a site I hand-coded over ten years ago, and, reading through it one day, I realized it was egregiously outdated in both form and content.

Screen cap of my old site, with images from my senior thesis show at Bard College.

Screen cap of my old site, with images from my senior thesis show at Bard College.

My practice has changed in ten years - like many people who set out to be artists, I now wear multiple hats. At first this was simply a strategy of staying afloat amidst the financial crisis and hostile takeover of the Bay Area which has squeezed out so many artists. But as I explored various roles - including running a gallery, teaching, arts management, and legacy planning - I realized that I can make good use of my skills in this expanded field, and hopefully give something back to the community.

Throughout this time, I have strived to keep my practice alive. At times I’ve had to adapt to circumstances - much of my recent digital collage work was created because it’s more practical to hop on the computer after dishes and before bed than it is to start an ambitious, physically-demanding project. With a little help from my friends, I’m looking forward to the next ten years of productive work!